
The App Store is a different animal than it was five years ago
AI has collapsed the skill barrier in software. Tasks that used to require a team of engineers now require a few good prompts and a weekend. The result shows up everywhere, but nowhere as clearly as the App Store. Apple is processing more submissions than ever, in every category, at a pace that keeps accelerating.
The natural reaction to this is anxiety. More competition means fewer users for each app, right? We thought the same thing at first and we have since changed our minds completely.
When a category fills up with apps, that category gets more search traffic, more editorial attention, more cultural surface area. People discover they have a problem they need solved, and they find ten apps trying to solve it. The market does not divide. It expands. The real challenge is not that there are too many apps. The challenge is simpler and harder: getting discovered at all. That is exactly the problem paid acquisition is designed to solve.
Why you cannot just wait for organic
There is a version of the app launch story that sounds very clean. You build something great, you release it, people find it, word spreads. That story exists. It just almost never applies to a brand new product with zero reviews, zero ratings, and no historical signal in the algorithm.
The App Store search algorithm, like any recommendation system, feeds on data. It wants to see engagement, installs, people coming back. A new app has none of that. So the algorithm ignores it, which means fewer installs, which means less data, which means continued invisibility. It is a cold start problem and it is brutal.
Paid acquisition is the way out. You buy a first wave of users. Those users leave reviews, generate engagement data, and give the algorithm something to work with. You are not buying users as an end goal. You are buying the minimum viable social proof that makes the organic engine start spinning.
There is a second reason to run paid campaigns that is less obvious: you need data. If you never buy users, you genuinely do not know whether your product converts. You do not know what percentage of people who hit your paywall actually subscribe. You do not know your D1 retention. Paid acquisition is your measurement instrument as much as it is your growth engine.
Before you spend a single dollar, a few things need to be in place. You need your tracking pixels integrated into the app for Meta and TikTok. You need a Mobile Measurement Partner (we use AppsFlyer) to handle attribution and relay events back to the ad platforms. You should be tracking at minimum D1 and D7 retention: how many users return one day after install, and how many return after seven days. These two numbers will tell you more about your app health than almost anything else.
Your onboarding needs to be built around conversion. We have observed consistently that over 80% of conversions happen at the paywall on the very first session. Attention peaks the moment someone installs your app and drops fast after that. If you bury your paywall three sessions in, you have already lost most of the people who would have subscribed. Hit them early. Ask for a store review during onboarding. It feeds the organic search algorithm. First launch is your peak moment of attention, build your product to capture it.
Phase 1: figure out what resonates, and watch your creatives age
The goal of the first campaign is not to be profitable. The goal is to generate installs cheaply and learn what works.
Run €20 per day per platform. We test Meta and TikTok simultaneously from day one. They reach different people through different content formats, and what converts on TikTok can look completely different from what converts on Meta. You want to understand both.
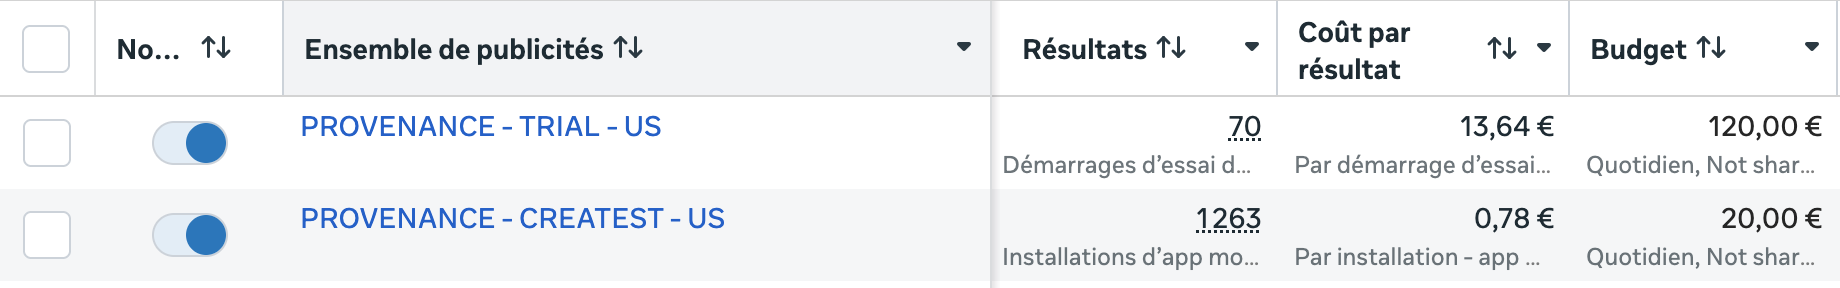
The metric to watch is CPI, Cost Per Install. For US users, we target below €1.20. US users cost more because they spend more. A €0.60 install from a market where subscriptions do not convert is worth less than a €1.10 install from someone with five active subscriptions on their phone. Cheap installs from the wrong market are not cheap at all. On Provenance, our install campaign runs at €0.78 per US install, well inside that threshold.
Run each creative for a minimum of 48 hours before drawing conclusions, maximum 72 hours. The temptation to kill a creative after a bad first day is real and almost always wrong. Algorithms need time to learn.
Here is something Phase 1 will teach you quickly: creatives burn out. An ad that performed brilliantly in week one starts losing its edge in week three. The audience has seen it. The algorithm has extracted what it can from it. This creative attrition is natural and relentless, and it means the work of finding and testing new creatives never stops. Phase 1 is not a launch event. It is a permanent infrastructure you will be running as long as you are spending money on ads.
The signal you are looking for by the end of Phase 1 is roughly 7 to 10 percent of users starting a trial at the paywall. Below that, something in the onboarding or paywall needs work before you go further.
Phase 2: build a creative academy and start buying intent
After a solid week of Phase 1, you have trial start events flowing through AppsFlyer. Now you feed those events back to Meta and TikTok and launch a second campaign, this time optimized for trial starts rather than installs.
One thing that is critical here: Phase 2 uses the best creatives from Phase 1, specifically the ones with the best CPI, because if they drove cheap installs they are the ones most likely to drive cheap trials too. You are not starting from scratch, you are promoting your winners.
But you do not turn off your install campaign. This is important and it took us a while to understand why. The two campaigns serve different functions and they complement each other. The trial campaign is more expensive per event but generates fewer users overall. The install campaign continues feeding conversion data and paywall data into your product while staying cheap to run at €20 per day per platform.
More importantly, your install campaign becomes what we think of as a creative academy. Here is how the loop works: you test a new creative for 48 hours on the install campaign. If the CPI is excellent, you graduate that creative into the trial campaign where real money gets made. Then you go back to the install campaign and start iterating to find the next winner. The install campaign is your testing ground, your nursery, your early warning system for creative fatigue.
This is why running both campaigns in parallel matters so much. The trial campaign is your revenue engine. The install campaign is how you keep that engine fed with fresh material.
On the budget side: €20 per day for the install campaign and €100 per day minimum for the trial campaign. That is €120 per day per platform, roughly €3,600 per month. Starting with a single platform at that budget is perfectly reasonable and probably enough to get meaningful signal. Running Meta and TikTok in parallel doubles the spend but also doubles the learning surface.
The other thing worth saying: the trial campaign is not a pure cost. It is generating revenue. The €3,600 per month is an upfront investment, but one that starts returning as soon as conversions come in. If you have a tighter budget, you can run with less, but the lower the daily spend, the longer you need to leave campaigns running before drawing conclusions. The algorithms need volume to learn.
Phase 3: know your numbers, stop being blind
Before you think about scaling, you need to know whether what you are running is profitable at all. This is where a lot of people skip a step, and it is an expensive skip.
The metric is ROAS: Return on Ad Spend. It is the simplest possible ratio: revenue generated divided by money spent on advertising. A ROAS of 1.0x means you are breaking even. Above it you are making money. Below it you are subsidizing your users and you need to understand why before going further.
Calculating ROAS for a subscription app requires a bit of care because you are not selling a product at a fixed price. You are selling a trial that may or may not convert. The formula we use is:
Expected revenue per trial start = conversion rate x net revenue per subscription
Then ROAS = expected revenue per trial start / cost per trial start
Let us walk through the real Provenance numbers. Our Meta trial campaign for Provenance in the US is running at €13.64 per trial start. The yearly plan is €29. We enrolled in Apple’s Small Business Program which drops the commission from 30% to 15%, so net revenue per subscription is €29 x 0.85 = €24.65. Our observed trial-to-paid conversion rate over the past few weeks is 51.9%.
Expected revenue per trial = 51.9% x €24.65 = €12.79
ROAS = €12.79 / €13.64 = 0.94x
We are just below break-even after one month of testing. Essentially at equilibrium. That is actually a reasonable place to be at this stage. We know the conversion rate is solid, the creative is finding the right audience, and the main lever now is bringing that cost per trial down through better creatives. Getting it from €13.64 to €12 would push ROAS above 1.0x and make the campaign cleanly profitable.
To put the budget in perspective: at 0.94x ROAS on a €3,600/month spend, the campaign is generating roughly €3,384 in revenue. The actual net cost out of pocket is around €216 per month, not €3,600. The gross spend is the working capital you need to have available, but the real burn is much smaller when the campaign is close to break-even. A campaign at 1.2x ROAS on the same spend would be cash-positive by €720 per month, which changes the conversation entirely.
The harder problem is visibility. With a 7-day free trial, you are blind for at least a week after any campaign change. You are spending money, trials are accumulating, but you do not know how many will convert until the trial period expires. And that is just the short-term blindness. The longer-term picture is more complex.
When you run campaigns continuously and rotate creatives regularly, you are effectively buying different batches of users every week. Some acquired in a week where a great creative was running, some in a week where you were testing something weaker, some on Meta, some on TikTok. These users do not behave identically. A user who subscribed to a yearly plan in January will potentially renew twelve months later, meaning the revenue from that campaign decision shows up a year down the line. A weekly subscriber who churns after three weeks generates a very different lifetime value from one who stays six months.
The question you need to be able to answer at any point is: for a specific group of users acquired during a specific period, what is the total revenue generated, and how does it compare to what was spent to acquire them?
The answer is cohort monitoring. You group users by the week they first opened the app, and you track what happens to each group over time independently. For each cohort you see the spend, the trial starts, how many converted, how many churned, and what total revenue looks like as the cohort ages.
To solve the blindness problem for recent cohorts, we built a predicted ROAS calculation into our dashboard. For cohorts with trials still running, we apply a benchmark derived from the last four fully settled cohorts: their average conversion rate and average net revenue per subscriber. We multiply active trial count by that conversion rate to estimate future paid subscribers, multiply by average revenue, add the revenue already collected, and divide by total spend. It is a directional estimate, not a guarantee, but it gives us a signal within days of a campaign launching instead of waiting ten days for trials to clear.
Here is what a recent Provenance cohort looks like in our dashboard, Mar 9 to Mar 15, now 16 days old:
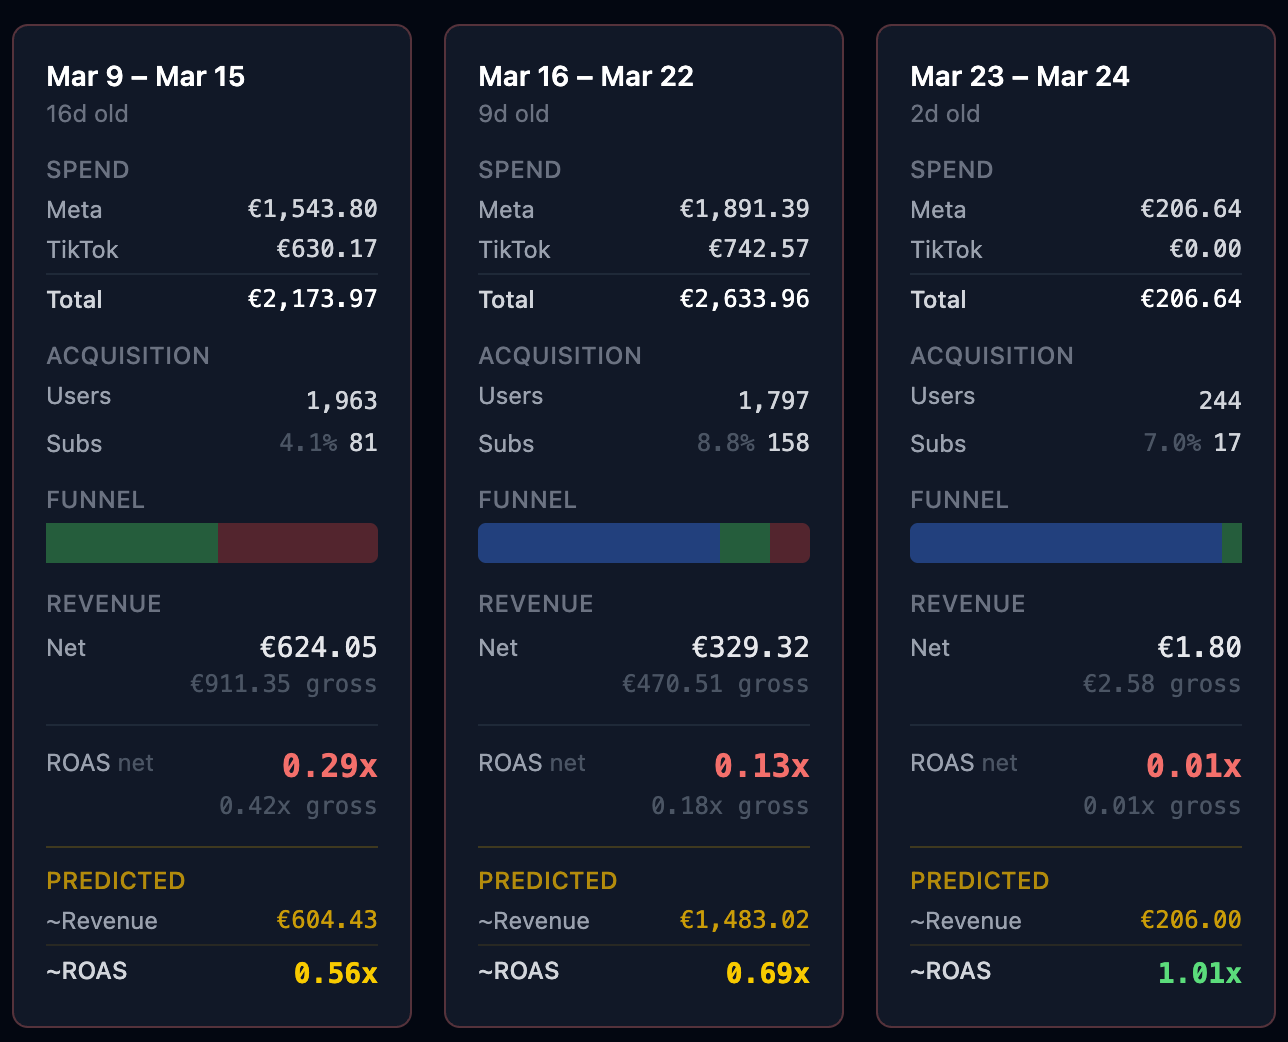
We built the dashboard on RevenueCat’s API for subscription data and Meta and TikTok’s reporting APIs for spend, with cohort boundaries aligned to our campaign calendar. We wrote a dedicated post on how it is built and why.
Phase 4: scale when everything is green
Once your ROAS is consistently above 1.0x and your cohorts are trending in the right direction, you have a decision to make: increase the budget and push for growth.
The principle is straightforward. If a campaign is profitable at €3,600/month, it should be profitable at €10,000/month. In practice it is more nuanced. The algorithm has already served your best-converting users first. As you push up the budget, it reaches deeper into a broader audience pool and unit economics tend to soften. This is expected and manageable, but scaling requires a different level of attention to your numbers and to your creative pipeline.
There is also a question of how to allocate spend intelligently across platforms, creatives, and markets as budgets grow. That is a subject we will cover in depth in a dedicated post.
The stack, briefly
Meta Ads and TikTok Ads for campaigns. AppsFlyer for attribution, event management, and sending trial events back to the platforms. RevenueCat for subscription management and revenue data. A custom cohort dashboard sitting on top of all of it.
We want to be transparent about what this is. We are not a growth consultancy. We are a small independent studio running real campaigns with real money and sharing what we observe. The specific numbers in this post will shift as we collect more data. The framework has held up.
Buy data early. Measure the right things. Build a creative loop that never stops. Optimize toward trial conversion. Monitor cohorts instead of aggregate metrics.
More posts to come on each of these in depth.